State of Health… What is that? [The Battery Cycle #6 | 2026 RELEASE]
What does State of Health actually measure, and who defines it? Exploring how BMS software, capacity buffers and degradation tracking shape the reported SoH, revealing the gap between technical battery condition and the available capacity
Five years ago, with insights from Claudius Jehle, CEO of volytica diagnostics GmbH, we launched “The Battery Cycle” series of articles, aiming to shedding light on the complexities of Li-Ion batteries.
The series provided a huge amount of valuable insights for anyone involved in electric mobility.
Now, five years later, we return to those same topics – still thanks to the collaboration with Claudius Jehle – enriched by real-world data and lessons learned.
The full series of articles, freshly updated, is also published in a monographic special feature accompanying Sustainable Bus (and sister platform Sustainable Truck & Van and Powertrain International) issues throughout 2026.
We welcome your questions, feedback and contributions at info@sustainable-bus.com.
Welcome to a new article of the Battery Cycle – a series of articles dedicated to demystify this blackbox in easy language, but technically bullet proof. Our last article explained what balancing is, and why it is crucial for proper asset performance. As the series is built upon each other, we strongly advise to have a look at all the other prior articles (about different chemistries, SOC, charging).
The term State of Health or SoH is easily the most controversial term in the battery industry. No other – spoiler: un- or ill-defined – term is used so liberally and in so many contexts and for so many purposes as SoH. If we could turn back time, we would try to get rid of it altogether, hence we often tend to put it in quotes. For reference, almost all financial warranty risk of the whole industry is tied to SoH, but the industry lacks a universal definition of this: unprecedented in the younger industrial history.
But as a matter of fact, it is there, so what is it, and what is it not? Let’s find out.
To set the stage, we will use SoH broadly speaking as a relative (i.e. in %) measure for battery capacity – and not as a measure for resistance, performance, safety or so. But trust us, this is complex enough.
Phenomenology of degradation
SoH is widely used in degradation contexts, i.e. how much is left after so-and-so-many years, and this is not wrong, but certainly also not the whole truth. The fact alone that the amount of dis/chargeable energy depends on the conditions, and that disbalance between cells have a significant impact on the system performance, suggests that not only long-term effects play a role here.
In the most general and widely accepted definition, SoH is a momentarily available capacity, measured in a balanced (!) battery by discharging (!) from BMS 100% SoC to BMS 0% SoC, using a constant current (or power), and that result divided by a reference value, e.g. a nominal type-plate value. You might recognize that this sentence – and we even simplified it – offers ample room for interpretation, argumentation and dispute. Words like ‘momentarily’, ‘available’, charging vs. discharging, constant current vs. constant power, ‘capacity’, and ‘reference’ allow different perspectives. Let’s start with the most stunning: ‘available’.
Hands-on tips: Ensure you develop a clear understanding of the different interpretations of State of Health (SoH) and maintain a continuous, holistic view of residual capacity across your fleet. Manual capacity tests alone cannot provide these insights. Be cautious when interpreting manual capacity test results, especially those provided by OEMs. The additional cost of continuous, advanced battery capacity analysis (including technical capacity evaluation) is negligible compared to the operational and financial impact it can deliver.
It might not come as a surprise that the BMS has a word to say about how it controls the battery and e.g. the voltage limits. We learnt in recent articles that it maintains an ‘operational’ SoC, the one we see on our displays and tools, and that 0/100% does not ‘technically’ mean empty/full – it’s just what it makes available to you, retaining some technical reserves.
When degradation stays hidden…
So far, so obvious. But imagine the BMS always making the same amount available to you, year over year? You bought an asset with 300 kWh capacity, and you perform a test at delivery: Voilà, 300 kWh. And you use it heavily, and in year 5 your test yields: 300 kWh. Some might be proud (“Look how careful and battery stress-aware we are!”), some might be skeptical (“How can that even be, why does it not degrade?”).
This little thought experiment is very relevant and various battery manufacturers employ this ‘Eat the buffer’ logic: excess capacity is installed, and constantly ‘eaten away’ by degradation – but shielded from the user as long as possible. Until the technically available capacity has degraded so far that it falls below the programmed…
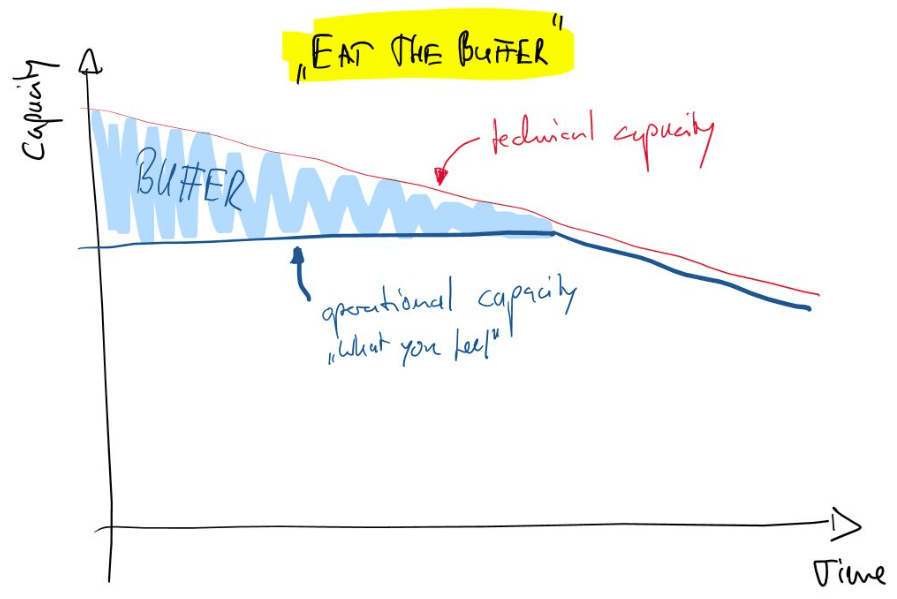
This graph compares technical capacity (red) and operational capacity (blue) over time. It shows how the BMS gradually reduces the buffer to maintain stable performance and mask early degradation.
Please note: the capacity that you experience in daily operation, and during capacity tests, is first-and-foremost software-defined; it is not necessarily affected by degradation, depending on the implemented BMS strategy.
You need proof? Here you find both the technical (reddish) and the operational (net) capacity (blueish) for a ca. 500 kWh e-bus for 1 year, analyzed by volytica’s continuous monitoring engine. You will clearly observe at least two things:
1. The BMS of this e-bus employs such ‘eat the buffer’ strategy: the operational capacity stays absolutely constant…
2. …while the ‘real’ capacity does, albeit slowly, show a downward trend.
In ca. seven years from now, the buffer will have been consumed, and the BMS will need to reduce the operational capacity in line with the rate of degradation. Without such advanced and continuous analysis, owners and operators are left with very labor-intensive manual capacity checkups, which never assess the technical capacity, but only the – here always constant – operational one.
Keep the buffer
Of course, there is another such philosophy, lets call it ‘Keep the buffer’, which is also frequently employed and feels more natural to most people – because it, at least apparently, does degrade: the operational capacity is not kept constant by software, but it decreases more or less parallel to the technically available capacity – requiring much more sophistication from the BMS, as it must have means to closely track the actual, electrochemical capacity, much more frequent and precise as in the other case.
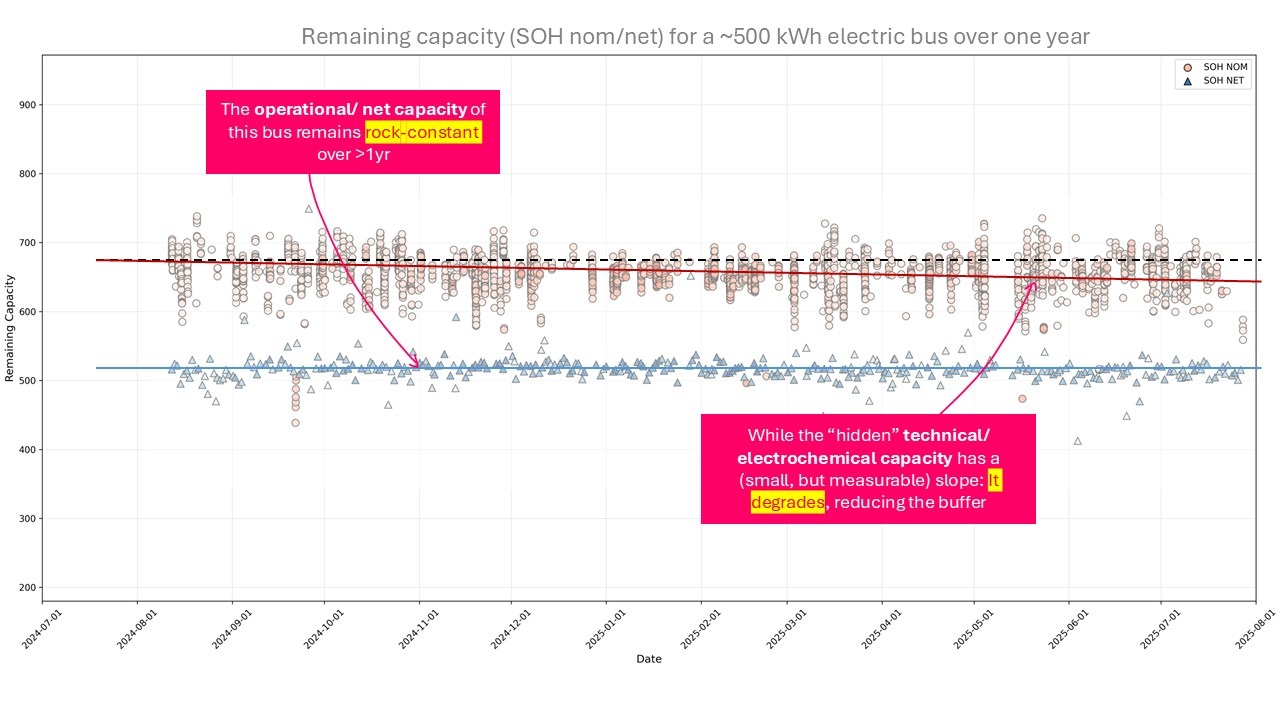
Continuous monitoring data from a 500 kWh e-bus over one year, showing stable operational capacity while technical capacity gradually declines, reducing the internal buffer.
If it can’t, because it is technologically a challenging endeavor, and it assumes a rate of decrease that is steeper than the actual degradation, the perceived loss of performance and value is unnecessarily high!
SoH, end of life and safety
A hard-to-eradicate rumor has it that a battery is at its ‘end of life’ once the SoH reaches an OEM-defined threshold, say 70%. There is already a kind-of obvious catch here, namely that ‘the’ SOH is the operational, day-to-day available net capacity, which is programmed and decided by the BMS. As we learned, a battery might have plenty of technical reserves left, even if the BMS-released SoH already reached said threshold. We have seen cases of operational SoHs that reach 70.0% exactly on the last day of an 8-year warranty, but our analysis yielded plenty of remaining technical capacity reserves – evil to him who evil thinks.
But even if speaking of ‘end of life’ is grossly misleading – it might be the end of the warranty, but for sure a battery is not dangerous or in other forms ‘dead’. Safety for instance is, if at all, only weakly linked to residual capacity! Many other factors are way more important and significant to judge the end of life!
At a glance
The capacity you experience in daily operations and during capacity tests is primarily software-defined. Depending on the implemented BMS strategy, it is not necessarily affected by degradation.
The BMS defines the capacity you get (and legend has it, in rare cases does not want to) tell the entire truth about the full technical capacity.
BMS systems follow shades of gray between the two fundamental strategies: ‘keep or eat the buffer’. The latter leaves a ‘blind’ operator with the impression of no degradation, an infinite lifetime, and perfect value retention.
We strongly advocate replacing the notion of ‘SoH low = end of life’ with ‘end of warranty’. To determine the true ‘end of life’ of such a precious and versatile component, it is better to take a few looks and perform more checks!