US transit bus manufacturing contributes $5.1 billion to GDP. BEVs reach 20% of recent deliveries
US heavy-duty transit bus manufacturing supported around 34,100 jobs and contributed $5.1 billion to US GDP in 2025, while battery-electric buses accounted for around 20% of recent deliveries, according to Oxford Economics. The figures come from Buses Mean Business: The Economic Impact of US Heavy-Duty Transit Bus Manufacturing, a September 2026 report developed by Oxford […]
US heavy-duty transit bus manufacturing supported around 34,100 jobs and contributed $5.1 billion to US GDP in 2025, while battery-electric buses accounted for around 20% of recent deliveries, according to Oxford Economics.
The figures come from Buses Mean Business: The Economic Impact of US Heavy-Duty Transit Bus Manufacturing, a September 2026 report developed by Oxford Economics and sponsored by Business Members of the American Public Transportation Association (APTA). The report was launched in conjunction with APTA Advocacy Day in Washington, D.C. and the bus coalition’s “Built in America: The Private-Sector Engine Behind Transit Buses” panel on Capitol Hill.
The study analyzes the economic activity generated directly by US heavy-duty transit bus manufacturers, through their domestic supply chains and through household spending by workers. Oxford Economics estimates that the industry also supported $1.1 billion in federal, state and local tax revenue in 2025, with economic impacts recorded across all 50 states.
Beyond the economic impact calculations, the report provides data on the age and composition of the US transit bus fleet, annual vehicle deliveries and changes in propulsion technologies.
US bus deliveries at 4,690 units in 2025, still below pre-Covid
Approximately 4,690 transit buses were delivered in the United States and Canada in 2025, according to industry delivery data reported by Oxford Economics. This compares with 4,447 units in 2024 and 4,349 in 2023.
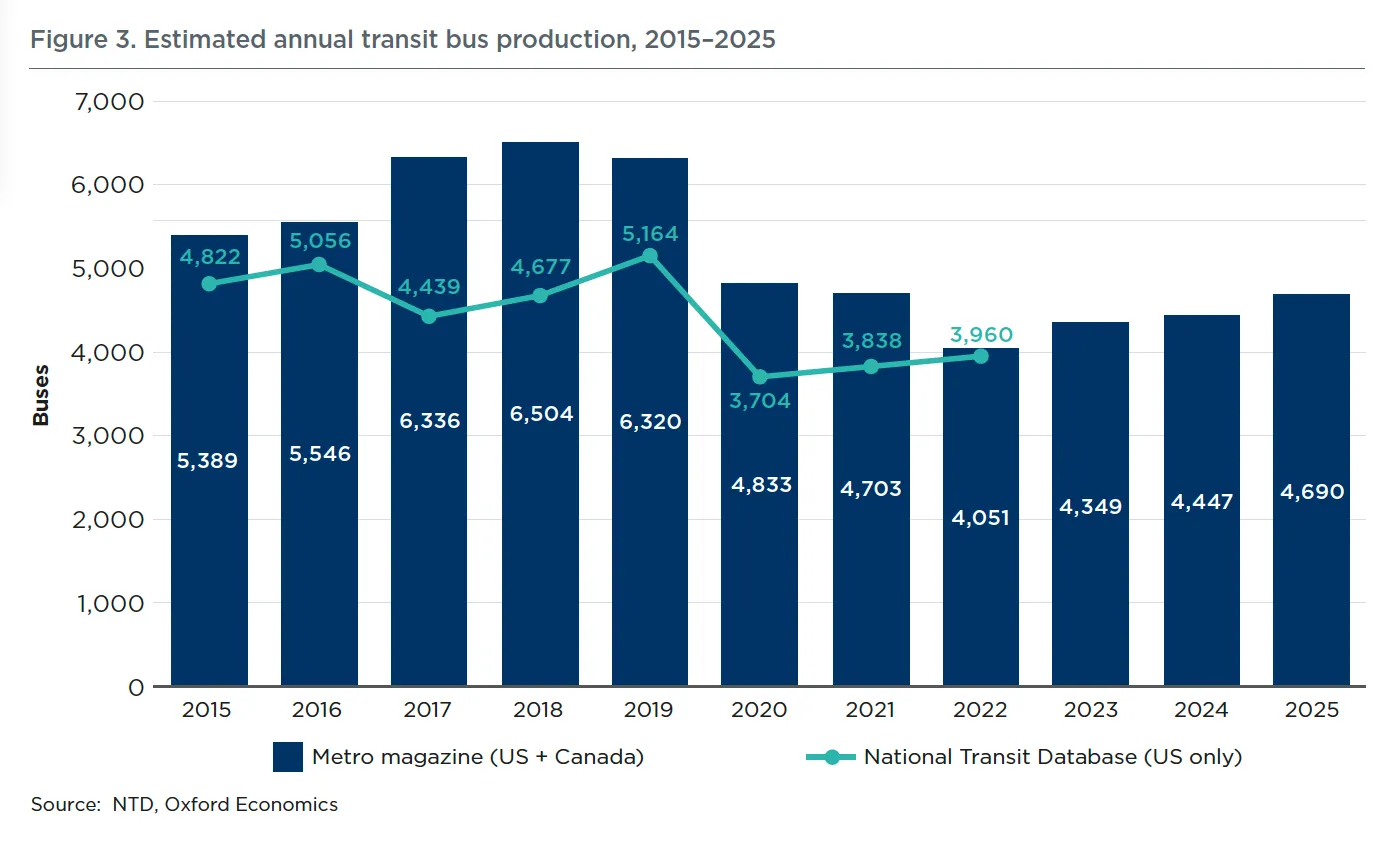
Deliveries remain below the volumes recorded before the Covid-19 pandemic. The study reports 6,320 buses delivered in 2019.
The existing US fleet comprises approximately 65,300 heavy-duty transit buses. Standard transit buses account for 82% of the total, with 40-foot vehicles alone representing 64%. Commuter buses account for 9% and articulated buses for 10%, according to National Transit Database data analyzed by Oxford Economics.
Fleet age is another element covered by the study. The average US transit bus was approximately eight years old in 2024. Around 13,700 vehicles, equivalent to 21% of the fleet, were already more than 12 years old, while another 21,500 buses were between eight and 12 years old.
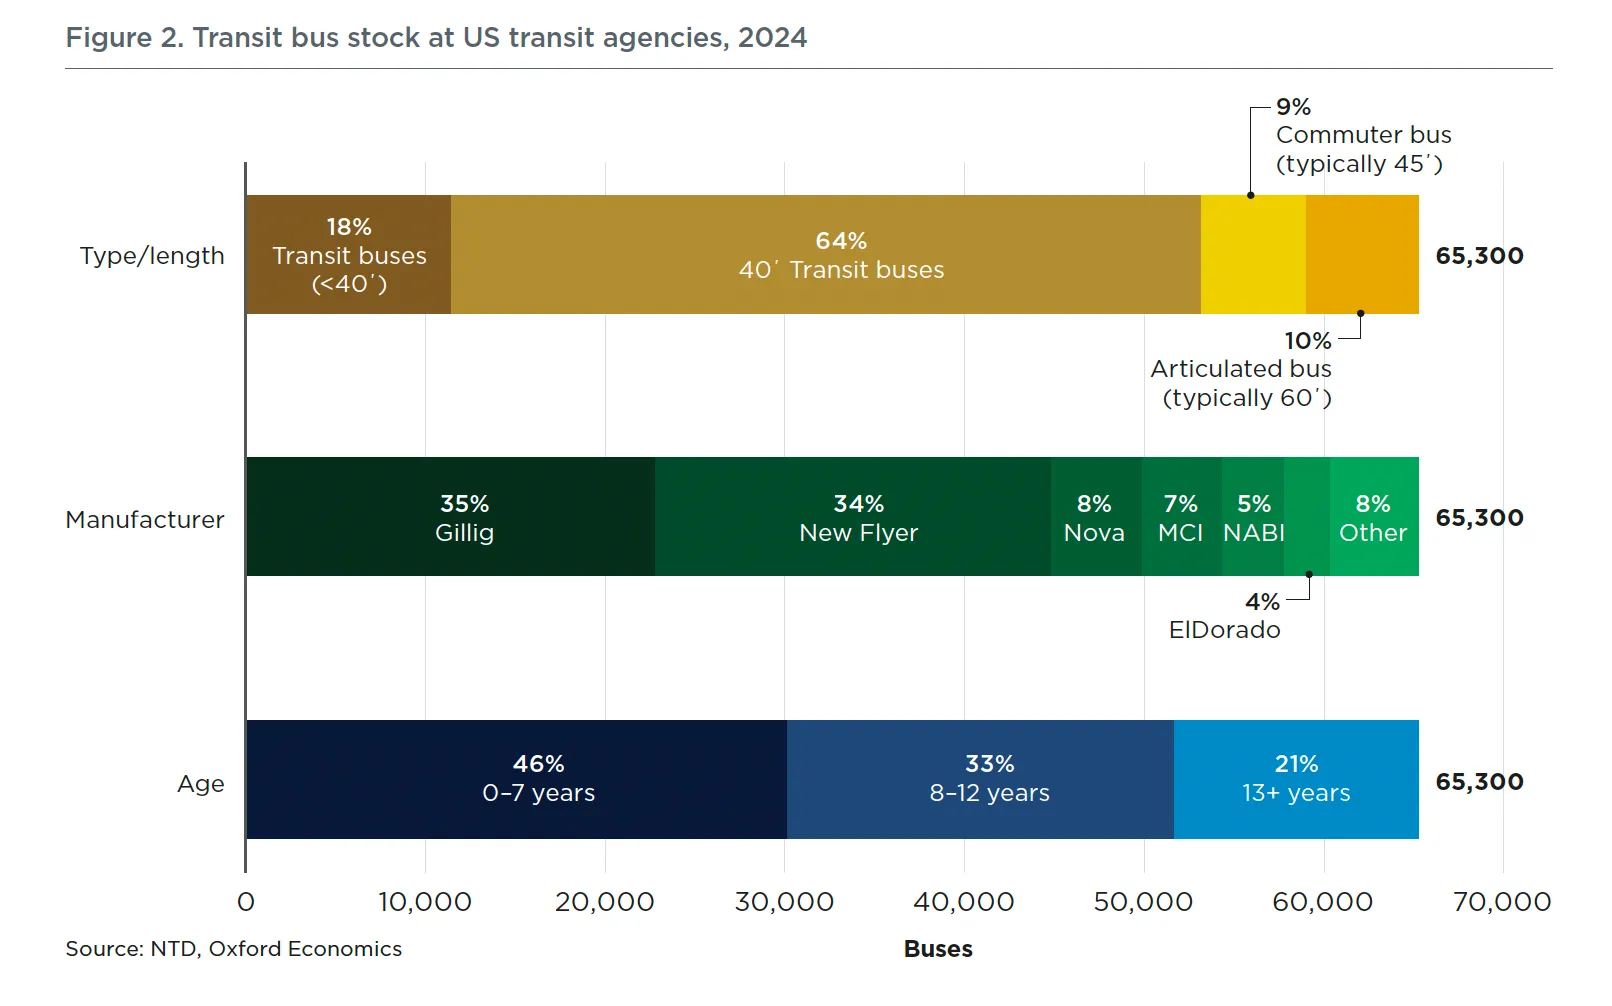
In total, approximately 35,200 buses, or 54% of the US heavy-duty transit bus fleet, either exceeded or were due to reach within five years the Federal Transit Administration’s minimum useful-life benchmark of 12 years or 500,000 miles for large heavy-duty transit buses.
Transit buses accounted for approximately 3.8 billion passenger trips in the United States in 2025, or more than 10 million trips on an average day. They represented 49% of all US public transit trips during the year.
Battery-electric buses reach 20% of recent US transit bus deliveries
Oxford Economics also records changes in the propulsion technologies represented in recent deliveries.
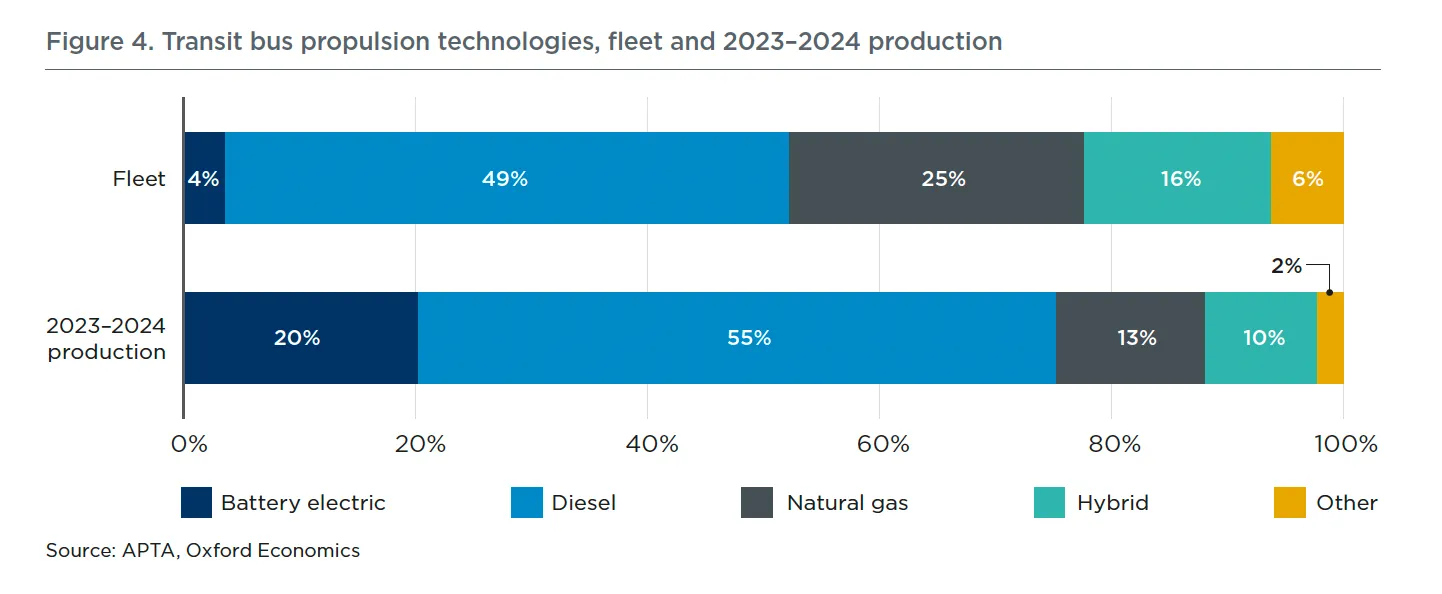
Battery-electric buses accounted for approximately 20% of transit buses delivered in 2023 and 2024, based on APTA Public Transportation Vehicle Database figures included in the report. Battery-electric vehicles represented approximately 4% of the overall fleet in service.
Diesel remained the largest propulsion technology among recent deliveries, accounting for 55% of buses delivered in 2023-2024. Diesel represented 49% of the existing fleet.
In brief
- How many transit buses were delivered in the US and Canada in 2025?
Oxford Economics reports approximately 4,690 deliveries, compared with 6,320 in 2019. - What share of recent deliveries was battery-electric?
BEVs accounted for around 20% of 2023-2024 deliveries, versus approximately 4% of the fleet in service. - How much of the US bus fleet is at or approaching replacement age?
Around 54% is already beyond or due to reach the FTA’s 12-year useful-life benchmark within five years. - What is the industry’s estimated economic footprint?
Around 34,100 supported jobs, $5.1 billion in GDP and $1.1 billion in federal, state and local tax revenues.
Natural gas accounted for 13% of 2023-2024 deliveries, compared with 25% of the fleet in service, while hybrids represented 10% of recent deliveries and 16% of the existing fleet. Other technologies accounted for around 2% of recent deliveries and 6% of the fleet.
Separate data from Catalyst Mobility (formerly Calstart), featured in the latest issue of Sustainable Bus magazine, show that, as of July 2025, US transit agencies and other operators had 8,116 full-size zero-emission buses funded, ordered, delivered or deployed, up 16% from 7,028 a year earlier. An additional 1,398 small zero-emission buses had been adopted nationwide.
The report also records ElDorado National’s resumption of transit bus production in 2025 under new ownership and Solaris’ entry into the US market through transit agency procurements. BYD’s US operations, marketed under the RIDE brand, continue to manufacture transit buses in Lancaster, California, while federal restrictions introduced in 2019 limit participation in federally funded transit bus procurements, Oxford Economics notes.
What is interesting, “Buses produced by the top two manufacturers, Gillig and New Flyer (NFI Group), accounted for nearly 70% of vehicles in service in 2024“. And production was even more concentrated in 2025, with the two manufacturers accounting for most heavy-duty transit bus deliveries, following Nova Bus’ US exit and NABI’s earlier integration into New Flyer.
US transit bus manufacturing supports 34,100 jobs
Against this fleet and production background, Oxford Economics estimates that US transit bus manufacturers directly employed approximately 4,700 people in 2025.
A further 15,900 jobs were supported through domestic supplier purchases and 13,500 through household spending by workers whose incomes depended directly or indirectly on transit bus manufacturing. The resulting total was approximately 34,100 jobs.
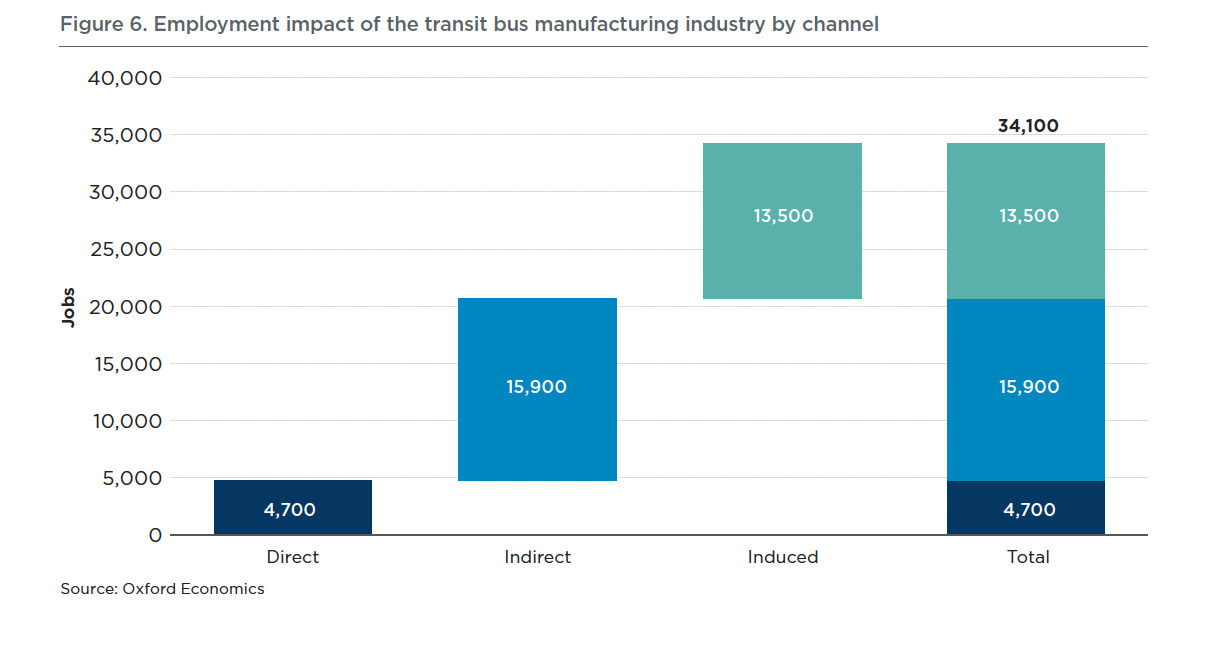
The report calculates an employment multiplier of 7.3. On this basis, every job directly employed by a transit bus manufacturer supported an additional 6.3 jobs elsewhere in the US economy through supply-chain purchases and household spending.
Manufacturing accounted for around 13,000 of the supported jobs, corresponding to 38% of the total. Trade and transportation accounted for 5,600 jobs, business services for 4,700 and other services for 3,800.
Transit bus industry contributes $5.1 billion to US GDP
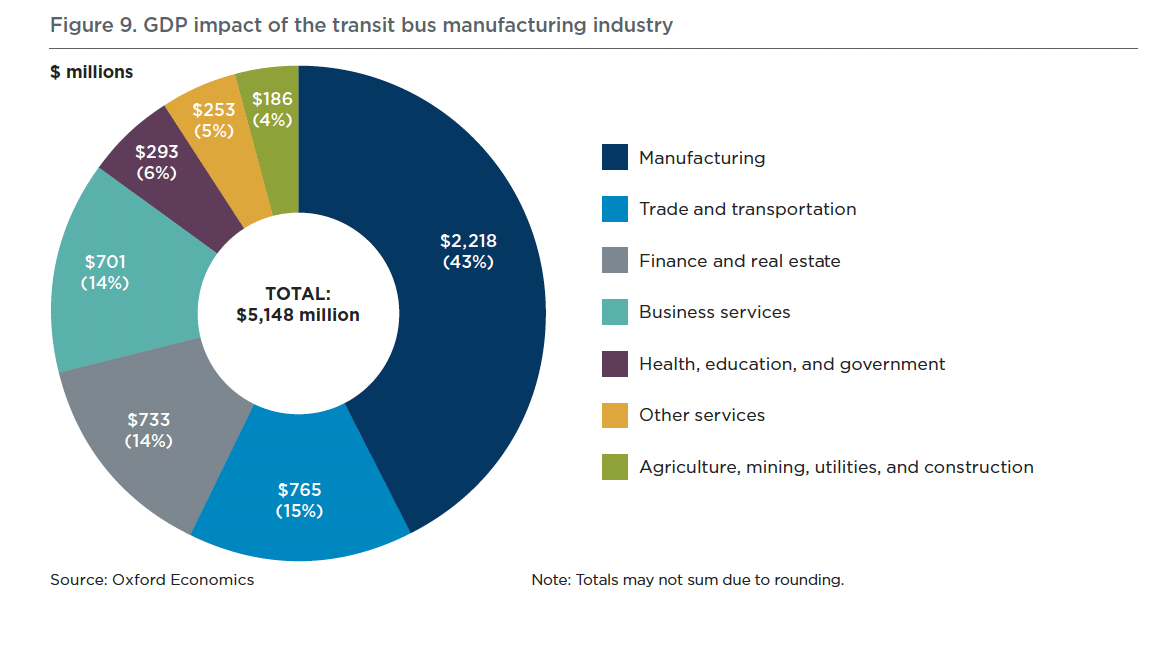
Oxford Economics calculates a total GDP contribution of approximately $5.15 billion in 2025.
Of this amount, $817 million was generated directly by transit bus manufacturers. Domestic supplier activity accounted for another $2.56 billion, while $1.78 billion was associated with household spending by workers.
Manufacturing represented approximately $2.2 billion, or 43%, of the total GDP impact. Trade and transportation accounted for $765 million, finance and real estate for $733 million and business services for $701 million.
The report calculates a GDP multiplier of 6.3, meaning that every dollar of value added generated directly by transit bus manufacturers was associated with an additional $5.30 in GDP through domestic supplier purchases and household spending.
Tax revenues associated with the three channels of economic activity totaled approximately $1.124 billion. Federal taxes represented $749 million, or 67% of the total, while state taxes amounted to $216 million and local taxes to $159 million.
Oxford Economics records economic impacts across all 50 states. Major transit bus assembly facilities identified in the report are located in Alabama, California, Minnesota, Nevada, New York and North Dakota.